Sunday, 10 January 2016

TRAINING (OBI-7) - OBIEE ADMIN TOOL - Part5 (Validating Repository)

OBIEE Admin Tool - Consistency Check
OBI Admin tools came bundled with an inbuilt feature of checking the consistency and validity of the rpd. These validation checks certain requirements before confirming the rpd as a valid rpd.

How to perform Consistency Checks in OBI Admin tools:
Consistency checks for entire repository or for individual objects could be performed by
1.) File > Check Global Consistency
2.) Tools > Show Consistency Checker
3.) Right Click the object > Check Consistency
4.) Save the repository

Consistency Checks performed by OBI Admin tool:
Some of these checks are listed below:

  • All logical columns are mapped directly or indirectly yo one or more physical columns.
  • All logical dimension tables have a logical key.
  • All logical tables have a logical join relationship to another logical table.
  • There are atleast two logical tables in the business model:
    • A logical fact table
    • A logical dimension table
  • Both can map to same physical table.
  • There are no circular join relationship.
  • A subject area exists for the business model.

Consistency Checks Output:
Consistency Checks output can be categorized in below three categories-
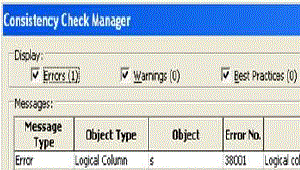


  1. Errors: Should be fixed to make repository valid and consistent.
  2. Warnings: Conditions that may or may not be an error but ideally must not be there.
  3. Best Practices: Good to follow the advise, but does not indicate any error or inconsistency.
Consistency check will check the logical checks but does not perform physical (va checks. For example in a join you could compare a date with number and consistency check will not error.  

Saturday, 9 January 2016

TRAINING (OBI-6) - OBIEE ADMIN TOOL - Part4 (Building Presentation Layer)

PRESENTATION LAYER
  • Presentation layer is the only layer visible to end users (Report Developer or clients).
  • Presentation layer is the second layer in the repository development.
  • Exposes only the data meaningful to the end users.

Presentation Layer Mappings
Presentation Layer objects map to objects in the BMM layer.
  • Subject Area map to Business Model.
  • Presentation table map to Logical Tables.
  • Presentation columns map to Logical Columns.

Presentation Layer Objects:


1. Subject Area (Called as presentation catalog in 10g)


  • One single Subject Area must be populated with content from a single business model and not from multiple business models.
  • Multiple Subject Area can reference same/common business model.
  • Different Subject Areas can be created to serve different set of user communities.

2. Presentation Table


  • Organizes presentation columns into categories that end users understand.
  • May contain columns from one or more logical tables.
  • Can be modified independently of logical tables.
  • Can be created:
    • Automatically by dragging logical tables from BMM layer.
    • Manually in the presentation layer.
2.1 Nested Presentation Tables


  • Give  the appearance of nested folders in Oracle BI application browser interface.
  • Prefix the name of the presentation folder to be nested with a hyphen and a space (- )..
  • Prefix the name of the presentation folder to be nested with a hyphen and a greater then symbol (->). space.
  • Place it after the folder (Presentation Table) in which it nests.
    • To create Nested Tables
      • Double click the the subject area.
      • Click on Add (+) button in Presentation Table tab
      • Mention the name of the nested table (Sub folder). Make sure to specify either -> or - in the description.
      • Click OK and then OK again.
      • Drag and drop all the presentation column/measure from presentation table to nested table.
      • Move nested table (Sub folder) below the parent presentation table (Parent folder).

3. Presentation Column


  • Define the columns used to build queries in the Oracle BI user interface.
  • Map to logical columns in the BMM layer.
  • Can be created: 
    • Automatically by dragging logical tables oor columns from BMM layer.
    • Manually in the presentation layer
3.1 Aliases


  • Keep track of any changes to Present layer objects.
  • Applicable for both presentation table & presentation columns.
  • As you can see in above screenshot SAL Column renamed to Salary has been tracked by Alias.

4. Hierarchy object (Newly introduced in 11g)

  • Used for Drill down Drill up analysis in business.

How to Build Presentation Layer:
To build the Presentation layer of a repository, you need to perform following steps:

1.) Create a new Subject Area.
Refer above notes.

2.) Create and map Presentation Tables
Refer above notes.

3.) Create and map Presentation Columns
Refer above notes.

4.) Create Presentation Hierarchy
Will discuss later.

5.) Save & Validate the rpd
Will cover in next session.

6.) Deploying the rpd on BI servers and test the user interface in the Presentation Layer
Presentation layer objects define the interface that users see to query the data from the data sources. Below screenshot displays look & feel of presentation layer in BI application browser window after we deploy the rpd on BI servers.


Presentation Columns are automatically renamed when the corresponding logical object is renamed. If you want to disable this property double click on the presentation column and uncheck the "Use Logical Column name" checkbox and click OK.


Presentation tables cannot have the same name as the Subject Area.
Presentation objects can be modified or deleted without affecting corresponding logical objects.


Key points to remember while designing the presentation layer:

  • Names cannot contain single quotation mark. The BI tool prevents it.
  • Use of double quote mark is permitted but should be avoided.
  • Keep presentation object names unique:
    • Naming presentation columns the same as presentation tables can lead to inaccurate results.
    • Uniqueness allows SQL statements to be shorter because qualifiers are unnecessary.
  • Eliminate unnecessary objectc to reduce confusion.
  • Keep names short to save space on reports.

Saturday, 2 January 2016

TRAINING (OBI-5) - OBIEE ADMIN TOOL - Part3 (Building Business Model and Mapping Layer)

BUSINESS MODEL & MAPPING LAYER
  • BMM Layer is also called as logical or business layer.
  • BMM layer is the second layer in the repository development.
  • BMM layer contains ‘n’ number of business models also known as subject area or data mart
  • BMM layer objects map to source data objects in the physical layer.
  • In BMM layer physical schema and objects are simplified to represent the user's view of the data i.e. technical terminology converted into business terminology. Eg: a column name EXPND going to be converted into Expenditure.
  • Maximum effort in rpd development is spend in this layer (approx 80% of overall rpd development)

Business Model Mappings
BMM & Physical layer objects mappings are typically not one-to-one:
  • One Business Model may map to multiple/different data sources.
  • One Logical Tables may map to multiple/different physical tables.
  • One Logical Columns may map to multiple/different physical columns.
  • One Logical Table Source may map to many physical sources

Business Model and Mapping (BMM) Layer Objects
BMM layer contains business model objects.


1.) Business Model

 
  • Highest level object in the BMM layer.
  • Contain the business model definitions and the mappings from logical to physical tables.
  • Simplifies the physical schema.
  • Object names are more business specific rather then technical.

2.) Logical Display Folder


3.) Dimension Hierarchies


4.) Logical Tables
  • Can be created:
    • Automatically by dragging tables from Physical layers
    • Manually by right clicking business model and selecting New Object > Logical Tables
  • Can be modified without affecting physical layer objects.
  • Can be of two categories.
    • Logical Dimension TableRepresent Dimension data
          
    • Logical Fact Table
      Represent Fact data
              

5.) Logical Table Sources


  • Defines the mapping from a Logical Table to a Physical Table
    • Logical tables may have multiple logical table sources
    • One Logical Table Source may map to many physical sources
  • Logical Table Source: Column Mappings
    Double click the Logical table Source > Click the Column Mapping tab to build, view or modify logical to physical column mappings.


6.) Logical Columns


  • Represent the business view of the data
  • May map to many column in the Physical layer
  • May be defined by other logical columns
  • Can be created:
    • Automatically by dragging tables or columns from the physical layer
    • Manually by right clicking a logical table and selecting New Object > Logical Column

7.) Logical Primary Keys


  • Define unique identifiers for logical tables.
  • Are required for each logical dimension table for a valid repository.

8.) Measures (columns with a scale icon)


  • Are the facts a business uses to evaluate its performance
  • Are calculations that define measurable quantities
  • Are created on logical columns in the fact table
  • Have a defined aggregation rule

9.) Logical Joins

  • Express the cardinality relationship between logical tables and are required for a valid business model.
  • Logical Join forms the foundation for BI server to understand the relationship between various objects of Business Model and how to construct the physical queries at run time.
  • Logical SQL won't generate with
  • Arrow mark at Dimension table end or at one's end (in one to many relationship). 
  • Logical join has no key relationship or expression defined as compared to physical join.
Why are joins defined again in Logical layer, when the joins are already defined at physical layer?
Since in Physical layer we can't define
1.) Driving Table (Which table will drive the query execution)
3.) Type of join (Inner, Left Outer, Right Outer, Full Outer Join)
2.) Cardinality (Relationship between tables 1-1, 1-M etc)
Also
4.) In BMM layer BI Admin tool can't understand if the table is dimension or fact table without join and assign dimension icon to all the tables until join is not defined. Once join is defined Logical fact tables icon is with # symbol and Logical dimension table without # symbol.
5.) Logical SQL is created on the basis of BMM Joins used for optimizing query which is used by BI sever.

Driving Table - Always select driving table which have less number of rowsas it helps in performance of SQL execution. Generally dimension tables contains less number of records, and is selected in Logical join as Driving table.

How to build Logical Layer:

1. Create the logical business model
Refer above notes.

2. Create the logical tables and columns
Refer above notes.

3. Define the logical joins

How to view existing Logical Joins in Logical layer:

Select the Business Model in BMM Layer > Right Click and go to Business Model Diagram > Whole Diagram > You should now be able to see the logical joins already created


Double click the arrow should open the Logical join properties.

How to create Logical joins in Logical Layer
> Select the Business Model in BMM Layer
> Right Click and go to Business Model Diagram
> Whole Diagram
> Click on new join icon  on toolbar
> Drag the Join Tool from D1 Manish First Logical table EMP to D1 Manish Second Logical table DEPT table ( Arrow mark at Dimension table end or at one's end (in one to many relationship))
> Click OK


Note that Logical join has no key relationship or expression defined as compared to physical join.

4. Modify the logical tables and columns
Rename, Reorder, Add, Delete logical tables, columns, sources.

5. Define the measures
Right Click the Logical Column and select Properties > Aggregation > Selection one of the Default Aggregation Rule from drop down > Click on OK > Logical Column icon changes to Scale representing a Measure.